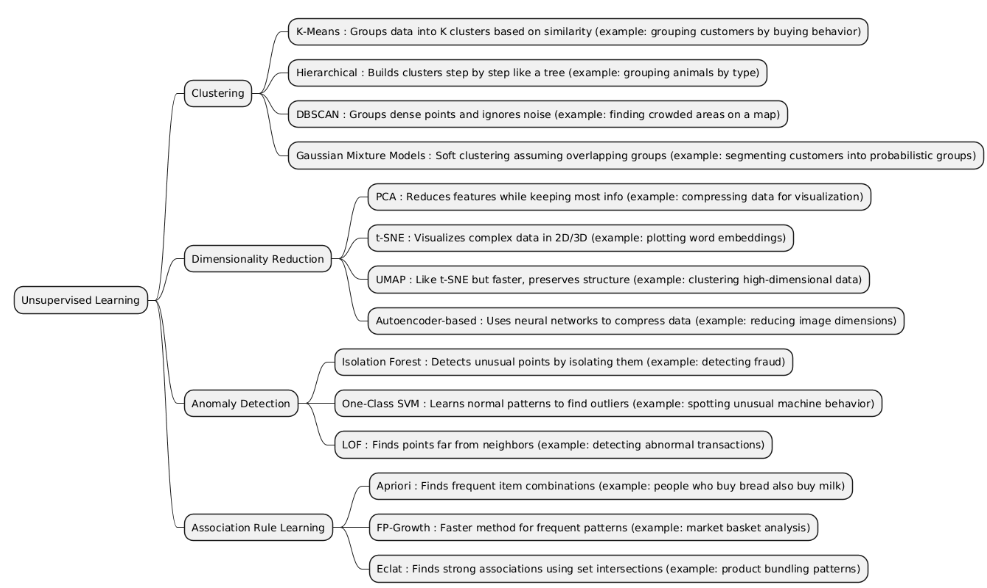
Unsupervised Learning is a branch of machine learning where the data has no labels or predefined outputs. The goal is to find hidden patterns, group similar data points, or discover the underlying structure of the dataset without prior knowledge of the correct answers.
| Type | What it is | When it is used | When it is preferred over other types | When it is not recommended | Examples of projects that is better use it incide him |
|---|---|---|---|---|---|
| Clustering | Clustering groups data points into clusters so that items in the same group are similar, and items in different groups are dissimilar, without using labeled data. |
• When you don’t have labels and want to discover hidden patterns or groups. • When you need to segment data by similarity (customers, images, documents, etc.). • Used in exploratory data analysis, pattern discovery, and preprocessing. |
• Better than Dimensionality Reduction when your goal is grouping data, not simplifying features. • Better than Anomaly Detection when you care about main group structures, not outliers. • Better than Association Rule Learning when you want natural clusters, not rule-based relationships. • Ideal when you need to understand dataset structure or create data segments for later analysis. |
• When you already have labels → use Supervised Learning instead. • When data has no clear group separation — clustering results become meaningless. • When your main goal is reducing dimensions → use Dimensionality Reduction. • When you want to detect rare abnormal points → use Anomaly Detection. • When relationships are logical or transactional, not based on similarity → use Association Rule Learning. |
• Customer segmentation for marketing campaigns. • Document clustering by topic. • Image grouping by visual similarity. • Genetic data clustering to find related species. • Social network community detection. |
| Dimensionality Reduction | Dimensionality Reduction reduces the number of features (variables) in a dataset while keeping the most important information. It simplifies data without losing essential structure. |
• When data has many correlated or redundant features. • To visualize high-dimensional data (e.g., 1000 features → 2D or 3D). • To speed up training, reduce overfitting, or improve model performance. • Common before clustering, classification, or regression to clean noisy data. |
• Better than Clustering when your goal is feature simplification, not grouping. • Better than Anomaly Detection when you want to compress data, not find outliers. • Better than Association Rule Learning when features are numerical or continuous, not categorical transactions. • Ideal when you need efficient representation or visual exploration of complex data. |
• When interpretability of features is critical (reduced dimensions lose meaning). • When dataset is small — reduction may remove useful information. • When features are already optimized or few in number. • When main goal is pattern discovery → use Clustering instead. • When goal is rule-based relationships → use Association Rule Learning. |
• Image compression or feature extraction (e.g., PCA on image pixels). • Visualization of large datasets in 2D (e.g., t-SNE, UMAP). • Noise reduction in sensor or signal data. • Speeding up model training on text embeddings. |
| Anomaly Detection | Anomaly Detection identifies unusual or rare data points that deviate significantly from the normal pattern in a dataset. It often works without labeled anomalies. |
• When the goal is to detect rare events or outliers. • Common in fraud detection, fault detection, cybersecurity, and monitoring. • Useful when anomalies are critical to identify, even if they are very few. |
• Better than Clustering when the focus is on outliers, not groups. • Better than Dimensionality Reduction when you care about rare events, not feature simplification. • Better than Association Rule Learning when anomalies are not frequent patterns, but deviations. • Ideal when detecting critical errors, attacks, or unusual behavior. |
• When you want to segment data → use Clustering. • When main goal is feature reduction or visualization → use Dimensionality Reduction. • When you want to find frequent patterns or rules → use Association Rule Learning. • When anomalies are well-labeled and frequent — supervised approaches may be better. |
• Credit card fraud detection. • Network intrusion detection. • Fault detection in machinery. • Medical anomaly detection (rare diseases or abnormal signals). |
| Association Rule Learning | Association Rule Learning discovers frequent patterns, correlations, or relationships between items in a dataset. It identifies rules like “if A occurs, B is likely to occur.” |
• When the goal is to find co-occurrence patterns in data. • Common in market basket analysis, recommendation systems, and transaction analysis. • Useful for discovering hidden relationships between categorical variables. |
• Better than Clustering when you want specific item relationships, not just groupings. • Better than Dimensionality Reduction when your goal is finding rules, not reducing features. • Better than Anomaly Detection when you want frequent patterns, not rare events. • Ideal when analyzing transactional or categorical datasets for associations and co-occurrences. |
• When data is continuous numerical → association rules may not apply directly. • When main goal is grouping or segmentation → use Clustering. • When focus is detecting rare events or outliers → use Anomaly Detection. • When goal is feature compression or visualization → use Dimensionality Reduction. |
• Market basket analysis (e.g., “customers who buy bread also buy butter”). • Product recommendation systems in e-commerce. • Website click pattern analysis (pages often visited together). • Analyzing co-occurrence of symptoms in medical records. • Fraud pattern detection in transactions. |
import numpy as np

X = np.array([
    [1, 2],
    [1, 4],
    [1, 0],
    [10, 2],
    [10, 4],
    [10, 0]
])

k = 2
max_iters = 10

centroids = X[np.random.choice(len(X), k, replace=False)]

for iteration in range(max_iters):
    clusters = [[] for _ in range(k)]
    for point in X:
        distances = np.linalg.norm(point - centroids, axis=1)
        cluster_idx = np.argmin(distances)
        clusters[cluster_idx].append(point)
    for i in range(k):
        centroids[i] = np.mean(clusters[i], axis=0)

print("Final centroids:")
print(centroids)

labels = []
for point in X:
    distances = np.linalg.norm(point - centroids, axis=1)
    cluster_idx = np.argmin(distances)
    labels.append(cluster_idx)

print("Cluster labels for each point:")
print(labels)
import numpy as np

X = np.array([
    [2.5, 2.4],
    [0.5, 0.7],
    [2.2, 2.9],
    [1.9, 2.2],
    [3.1, 3.0],
    [2.3, 2.7],
    [2, 1.6],
    [1, 1.1],
    [1.5, 1.6],
    [1.1, 0.9]
])

X_mean = np.mean(X, axis=0)
X_centered = X - X_mean

cov_matrix = np.cov(X_centered.T)

eig_vals, eig_vecs = np.linalg.eig(cov_matrix)

sorted_idx = np.argsort(eig_vals)[::-1]
eig_vecs = eig_vecs[:, sorted_idx]
eig_vals = eig_vals[sorted_idx]

X_pca = X_centered.dot(eig_vecs[:, 0].reshape(-1,1))

print("Projected data onto 1 principal component:")
print(X_pca)
import numpy as np
from sklearn.ensemble import IsolationForest

X = np.array([
    [1, 2],
    [2, 1],
    [1.5, 1.8],
    [10, 10],
    [1.2, 1.9],
    [2.2, 2.1],
    [0.8, 0.6],
    [9, 11]
])

clf = IsolationForest(contamination=0.2, random_state=42)
clf.fit(X)

pred = clf.predict(X)

print("Data points predictions (1=normal, -1=anomaly):")
for point, p in zip(X, pred):
    print(f"Point {point} => {p}")
from mlxtend.frequent_patterns import apriori, association_rules
import pandas as pd

data = pd.DataFrame([
    [1, 1, 0, 0],
    [1, 0, 0, 1],
    [1, 1, 1, 0],
    [0, 1, 1, 1],
    [1, 0, 1, 0],
], columns=['Milk', 'Bread', 'Butter', 'Eggs'])

frequent_itemsets = apriori(data, min_support=0.4, use_colnames=True)

rules = association_rules(frequent_itemsets, metric="confidence", min_threshold=0.7)

print("Frequent itemsets:")
print(frequent_itemsets)

print("\nAssociation rules:")
print(rules[['antecedents', 'consequents', 'support', 'confidence', 'lift']])